Production systems fail for many reasons. It could be bugs, config drifts, schema changes, version mismatches, just to name a few. In all these scenarios, the response looks the same: an engineer gets paged, digs through logs, diagnoses the problem, writes a fix that often takes one line, and pushes it through CI/CD. Total time - 30 minutes to several hours depending on who’s on call.
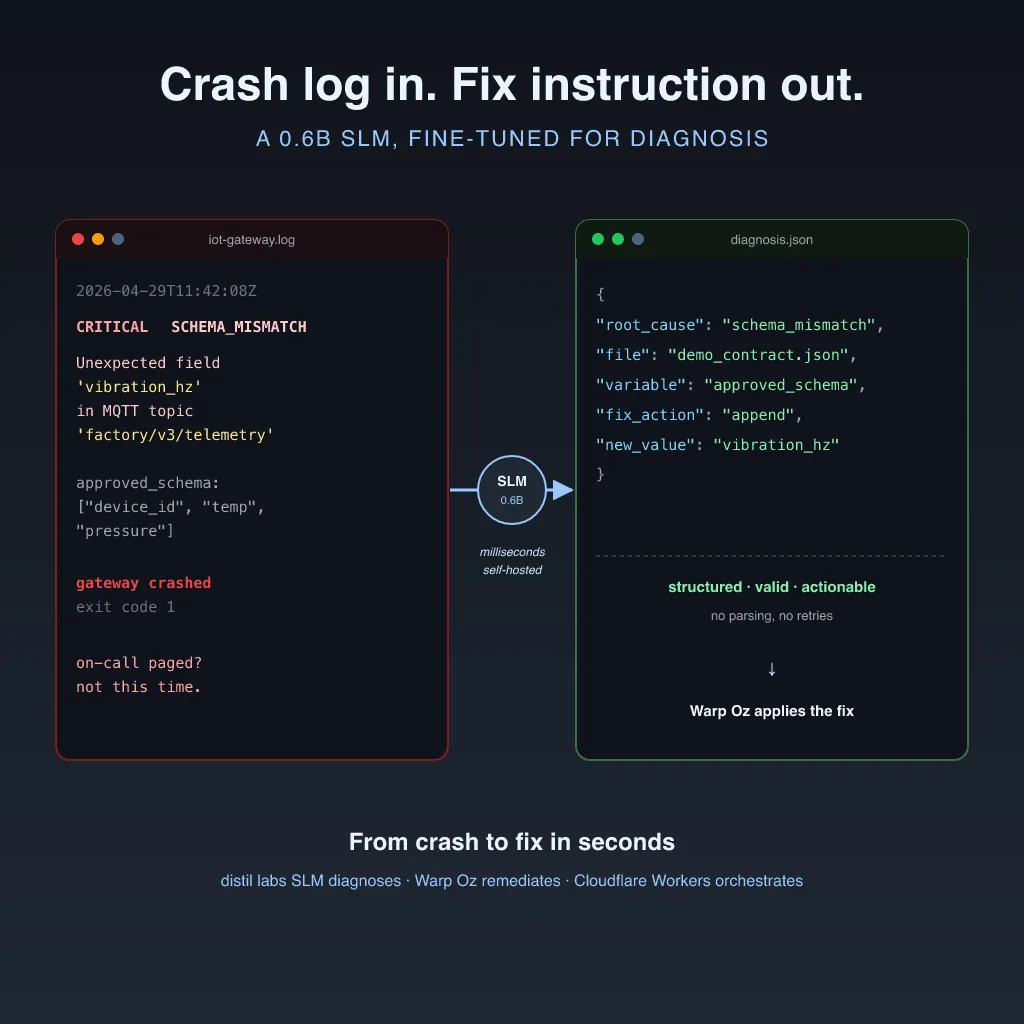
This post introduces an autonomous bug-fixing agent that closes that gap. A distil labs SLM called massive-iot-traces1 diagnoses the failure from a crash log and produces a structured fix instruction. Warp’s Oz agent claims that instruction, applies the fix, verifies it, and reports completion. The entire loop runs in seconds, with no human paged and no downtime.
The architecture is general-purpose. Any failure mode where the diagnosis is learnable and the fix is scoped can be plugged into the same loop. To demonstrate it end-to-end, we built a working demo around an industrial IoT schema-mismatch failure where a sensor firmware update introduces a field the gateway doesn’t recognize, and the gateway crashes. The IoT scenario is the proof point; the pattern applies to your own production systems. You can train your own diagnosis model on your operational traces using the distil labs platform and wire it into the same architecture.
This post walks through how we built it, the architecture decisions behind it, and how you can build your own self-healing loop using the same tools. The full working demo is open source: GitHub repository.
The architecture: separate the brain from the hands
The core design decision is that diagnosis and bug-fixing are handled by different components, deliberately decoupled.
The “brain” is massive-iot-traces1, a distil labs SLM fine-tuned on operational trace patterns. Its only job is to read a structured crash log and output a JSON diagnosis that includes the root cause, the file that needs to change, the variable involved, the fix action to take, and the new value to apply. It is small, fast, and optimized purely for pattern recognition across operational signals, not for generating code or holding a conversation.
The “hands” are Warp Oz, an autonomous agentic CLI. Oz receives the structured diagnosis, opens the right file, applies the change, runs verification, and reports the result back to the control plane. Oz handles the multi-step execution that a diagnosis alone cannot perform: file edits, shell commands, test runs, git operations.
The control plane is a Cloudflare Worker that ties the loop together. It ingests production telemetry, validates payloads, calls massive-iot-traces1 on failure, stores durable fix jobs, and exposes the API that Oz claims work from.
┌────────────────┐
│ Production     │
│ Service        │  telemetry
└───────┬────────┘
        │
        ▼
┌────────────────────────────────────────────┐
│ Cloudflare Worker (Control Plane)          │
│ - validates telemetry payloads             │
│ - calls Distil SLM on schema failure       │
│ - stores durable remediation jobs          │
│ - exposes Oz job API                       │
└───────┬───────────────┬────────────────────┘
        │               │
        ▼               ▼
┌──────────────┐  ┌──────────────────────┐
│ distil labs  │  │ Durable Object       │
│ SLM          │  │ (incident state)     │
│ (diagnosis)  │  └──────────┬───────────┘
└──────┬───────┘             │
       │ structured          │ claim job /
       │ diagnosis           │ report events
       ▼                     ▼
┌──────────────────────────────────────────┐
│ Warp Oz (Bug-Fixing Agent)               │
│ - claims durable job                     │
│ - applies scoped fix                     │
│ - verifies fix                           │
│ - reports completion                     │
└──────────────────────────────────────────┘
This separation matters for a practical reason. You can retrain the SLM on new failure patterns without touching the bug-fixing logic, upgrade or swap Oz without retraining the model, and scale the Worker independently as a standard Cloudflare deployment. Each layer evolves on its own timeline because none of them depend on the internals of the others.
Why a fine-tuned SLM instead of a frontier model
Operational diagnosis is the kind of task that fine-tuned small models were made for. It depends on system-specific vocabulary, known failure signatures, and a structured output format that downstream automation can consume, all of which are learnable from your own production data.
A frontier model can diagnose many kinds of failures, but it carries unnecessary overhead for this task. You are paying for broad reasoning capability when the job is really just pattern matching against a known set of operational traces. The diagnosis model only needs to look at a crash log and say: this failure maps to this file, this field, and this correction.
A fine-tuned SLM is faster, because the diagnosis needs to complete before a human gets paged. It is cheaper per invocation, which matters when the model runs on every failure event rather than once a week. And it produces a more predictable output format. Oz needs valid JSON it can act on, not free-form text that requires parsing and retries. The model is also tighter in alignment with your specific operational environment, because it was trained on your failure patterns rather than on general knowledge.
The cost difference matters because a bug-fixing loop only works if you can afford to run the diagnosis model on every failure event, not just the ones that seem important enough to justify an API call. A production system generating 1M to 10M telemetry events per day would cost roughly $1,500 to $75,000 per day to diagnose through a frontier LLM. At those prices, most teams would gate the model behind severity filters, which means some failures slip through undiagnosed and you’re back to paging humans for the ones you missed. A fine-tuned SLM on a self-hosted GPU runs the same volume for approximately $20 to $70 per day. At that cost, you can run diagnosis on everything and let the model decide what’s worth fixing, instead of building heuristics to decide what’s worth diagnosing.
There’s also a latency argument that ties directly to cost. A frontier LLM diagnosis means a network round-trip to an external API, plus queue time, plus inference on a massive model. That can take seconds, sometimes longer during load spikes, which are exactly when you tend to have the most failures. A self-hosted SLM returns in milliseconds because there’s no network hop and the model is small enough to run fast on a single GPU. When the goal is to close the loop before PagerDuty escalates, that latency difference determines whether the system actually fixes the bug before a human gets woken up.
Running the diagnosis on an external API also means your bug-fixing loop has an external dependency in its critical path. If the API is rate-limited or degraded during an incident spike, the self-healing system can’t self-heal. A self-hosted SLM removes that dependency entirely.
The economics also compound in your favor over time. Every new failure pattern you train the SLM on makes the model more capable, but the hosting cost stays flat because you’re running the same GPU. With a frontier LLM, the cost scales linearly with event volume no matter how many patterns you’ve already solved. The more failure modes you cover, the wider the cost gap gets.
distil labs’ massive-iot-traces1 model is a Qwen3-0.6B student distilled from a GPT-OSS-120B teacher through the distil labs platform. The platform took roughly 300 seed traces (automatically curated by an LLM judge for quality), generated ~10,000 synthetic training examples from them, and completed fine-tuning in under 12 hours. The result is a 0.6B model that produces structured JSON Oz can consume directly, so you don’t need prompt engineering, output parsing, or retry logic for malformed responses.
The demo: an IoT schema-mismatch failure
To make this concrete, the demo uses an industrial IoT gateway that validates sensor telemetry against a strict allowlist.
The gateway accepts payloads with known fields:
{
  "approved_schema": ["device_id", "temp", "pressure"]
}
A sensor firmware update starts sending a new field: vibration_hz. The payload is valid JSON. The device is behaving as designed. But the gateway rejects the unknown field, logs a critical error, and crashes:
CRITICAL SCHEMA_MISMATCH: Unexpected field 'vibration_hz' detected
in MQTT topic 'factory/v3/telemetry'
This kind of failure happens constantly in production systems. Schema drift and interface evolution are unavoidable as devices and services get updated. The fix is mechanical: just add the new field to the approved schema. That combination of a common failure with a mechanical fix is exactly where autonomous bug-fixing adds the most value, because the diagnosis is learnable and the fix is scoped.
The self-healing flow, step by step
Step 1: The production service sends telemetry to the Worker
The Python IoT gateway sends a telemetry payload to the Cloudflare Worker through POST /api/telemetry. When the payload contains an unknown field, the Worker’s validation rejects it and constructs a structured crash log.
You can trigger this from the gateway itself:
WORKER_URL=https://<your-worker>.workers.dev python3 iot-gateway/send_telemetry.pyOr from the demo dashboard:
# Click "Send Bad Telemetry (vibration_hz)" in the dashboard UI
# This calls POST /api/demo/telemetry through the Worker
Step 2: The Worker calls massive-iot-traces1
The Worker takes the crash log and sends it to the distil labs inference endpoint. massive-iot-traces1 reads the log and returns a structured diagnosis:
{
  "root_cause": "schema_mismatch",
  "file": "config/demo_contract.json",
  "variable": "iot_gateway.approved_schema",
  "fix_action": "append",
  "new_value": "vibration_hz"
}
That output is a structured fix instruction, not free-form text. It tells Oz exactly what to change, where to change it, and what the correct value is, and the model was fine-tuned to produce this format consistently.
Step 3: The Worker stores a durable remediation job
The diagnosis becomes a durable remediation job stored in a Cloudflare Durable Object. This gives the incident a persistent state that survives Worker restarts and can be tracked through the dashboard. The job sits in a queue until Oz claims it.
Step 4: Warp Oz claims the job and applies the fix
Oz polls the Worker’s job API (POST /api/remediation/next), claims the next open job, and executes the fix. In this case, Oz:
- Reads the structured diagnosis from the job payload
- Opens
config/demo_contract.json - Appends
"vibration_hz"to theiot_gateway.approved_schemaarray - Runs
python3 iot-gateway/reproduce_crash.pyto verify the fix - Reports
fixedorfailedback to the Worker throughPOST /api/incidents/:id/complete
The dashboard watches this in real time. The operator sees the incident move from diagnosed to claimed to fixed without intervening.
To trigger Oz manually after a diagnosis:
curl -s -X POST "https://<your-worker>.workers.dev/api/oz/trigger"Or set OZ_AUTO_TRIGGER=true in your Worker configuration so Oz starts automatically after every diagnosis.
What this means for engineering teams
The outcome here isn’t “AI that reads your logs.” It’s incidents that resolve themselves before an engineer gets paged.
On-call shifts from manual log analysis and hotfixing to supervision and exception handling. Engineers stop spending their sharpest hours rediscovering root causes they have seen before and start spending them on the system design that prevents novel failures. The common, mechanical, well-understood failure modes get handled by the loop. The novel, ambiguous, architecturally complex failures still go to humans.
The point isn’t to remove engineers from incident response. It’s to stop wasting their time on incidents that don’t require engineering judgment. A schema-mismatch crash that maps to a one-line config change should not be a 2am wake-up call.
The loop also gives you a natural audit trail. The diagnosis, the fix steps, and the verification results are all stored in the durable incident state, so you can review what the system did, when, and why. That trail is often more detailed than what a human would leave in a post-incident ticket.
Build your own self-healing loop
The full demo is a working repository you can clone and deploy. Here is the setup path:
Prerequisites
You need Node.js 18+, Python 3.10+, a Cloudflare account, a distil labs inference endpoint and API key, and the Warp Oz CLI (oz).
1. Clone and set up
git clone https://github.com/distil-labs/distil-self-healing-agent.git
cd distil-self-healing-agent
npm run setup
This installs Worker and dashboard dependencies, creates a Python virtual environment, and generates local env files from examples.
2. Configure credentials
Fill in your distil labs endpoint and API key in worker/.dev.vars:
DISTIL_ENDPOINT=https://your-inference-endpoint/v1/completions
DISTIL_API_KEY=your_distil_api_key
DISTIL_MODEL=distillabs/massive-iot-traces1
For Oz Cloud execution, also set:
WARP_API_KEY=wk-your-warp-api-key
OZ_ENVIRONMENT_ID=your_oz_environment_id
WORKER_PUBLIC_URL=https://self-healing-api.<account>.workers.dev
3. Deploy the Worker
cd worker
npm install
npx wrangler secret put DISTIL_API_KEY
npx wrangler secret put WARP_API_KEY
npm run deploy
4. Deploy the dashboard
VITE_WORKER_URL=https://<your-worker>.workers.dev npm run deploy:dashboard5. Trigger the failure and watch the loop
Open the dashboard, click “Send Bad Telemetry (vibration_hz).” The Worker rejects the payload, calls Distil, stores the fix job, and (if OZ_AUTO_TRIGGER=true) kicks off Oz automatically. Watch the incident move through diagnosed, claimed, and fixed in the dashboard.
For local Oz execution:
npm run oz:localFor Oz Cloud:
npm run oz:cloud6. Validate the fix
After Oz reports completion, verify the schema was updated:
python3 iot-gateway/reproduce_crash.pyIf the fix was applied correctly, the gateway accepts the payload that previously crashed it.
Adapting to your own failure modes
The demo uses one IoT schema-mismatch failure. The architecture supports any failure mode where the diagnosis is learnable and the fix is scoped.
To adapt this for your own system:
Train a diagnosis model on your operational traces. Use the distil labs platform to fine-tune an SLM on your specific failure patterns. The model needs to produce structured JSON that your bug-fixing agent can act on. The input is your crash logs. The output format is whatever downstream automation expects.
distil model create my-ops-diagnosis
distil model upload-data <model-id> --data ./your-traces
distil model run-training <model-id>
Point the Worker at your new model. Update DISTIL_MODEL in your Worker configuration. The Worker’s diagnosis flow is model-agnostic: it sends a crash log and receives structured JSON.
Write an Oz prompt for your fix pattern. The oz/remediation_prompt.md file tells Oz how to claim a job, what file to edit, how to verify the fix, and how to report completion. Swap this for your own workflow.
The architecture does not change. The diagnosis model, the Oz prompt, and the config contract are the three things you customize. Everything else (the Worker control plane, the durable incident state, the Oz job API, the dashboard) works as-is.
What’s next
The current demo runs one failure mode end-to-end. The architecture is designed for more.
Live streaming fixes. The next milestone is replacing the polling-based dashboard with a WebSocket connection that streams Oz’s terminal output in real time. You’d watch file edits, test runs, and verification happening live in the browser as the agent works through the fix.
Broader failure coverage. The same loop can handle any failure mode where the SLM can produce a structured diagnosis: dependency version conflicts, configuration mismatches, permission errors, resource limit breaches, certificate expirations. Each new failure mode is a new training dataset for the SLM and a new Oz prompt.
Part 2: real-time event streaming with Apache Iggy. In the next post, we will replace the polling-based architecture with Apache Iggy, a persistent message streaming server, to make the entire self-healing loop operate in true real time. Production events flow through Iggy, the diagnosis triggers immediately on ingestion, and Oz’s fix streams live into the dashboard as it happens. That post will show the system running against a continuous event stream rather than a single triggered failure.
How the pieces fit together
We built this demo by combining three tools that each handle one layer of the loop and connect through clean interfaces.
distil labs trains the diagnosis model. Production operational traces become a fine-tuned SLM that classifies failures and produces structured fix instructions. The platform handles synthetic data generation, training, and deployment. The model runs at the latency a real-time diagnosis loop requires.
Warp Oz executes the fix. It receives structured instructions and carries them out autonomously: file edits, shell commands, verification, and reporting. Oz operates in a sandboxed environment with scoped access to the target repository.
Cloudflare Workers runs the control plane. The Worker handles telemetry ingestion, diagnosis routing, durable state management, and the job API. Durable Objects give each incident persistent state. The Worker scales as a standard Cloudflare deployment with no infrastructure to manage.
The full demo is open source. Clone the repository, deploy it to your Cloudflare account, and run the loop end-to-end. To train your own diagnosis model on your operational traces, get started with distil labs.